Showing posts with label 490 project. Show all posts

06 February 2018

Rationale behind Methodology of my Thesis

This post is an extended reply to Thorfinn Tait’s recent comments and the discussion that has taken place in the Mystara Cartographic Society Facebook group.

First off, I want to say that I haven’t completely abandoned the project; it’s just on the back burner right now. I wasn’t satisfied with how the DEM for Karameikos turned out; there was too much irregularity with the dimpling and I didn’t like how the mountains plateaued, but my biggest issue is interpreting the b10 map. I can’t decide which lines should be ridges or valleys. Should it resemble something like the Appalachians or the Sierras? So, I’m just giving it time to stew in the back of my head and been working on other projects (which admittedly have not made it to this blog)

Many of  Thorfinn’s thoughts bear similar threads, so I’m going to go through talk and about general topics instead of addressing each comment directly.

I want to start by talking about assumptions and providing a basis for creating an accurate map. When making any map the first object of the cartographer is to find Data. This may come in the form of a spreadsheet or descriptive text, or old paper maps that have to be scanned, or electronic data designed for a GIS. However old or obscure the data is it has some relationship with a real geographic location on earth that can be given latitudinal and longitudinal coordinates. When working with most fantasy or science fiction worlds this isn’t true. A location on Tattooine cannot be geographically mapped because it is not on earth. Geography literally means writing or descriptions about Earth. Geography technically applies only to Earth; the geography of Mars for example is called areography. This is what I mean when I say that previous maps of Mystara are geographically inaccurate. Maps of Mystara can only be geographically accurate if using earth as a basis.

This basic premise that Mystara is Earth underlies my whole project. I have read all of Thorfinn’s work that I could find and love his maps and his whole Atlas of Mystara project. My own meager efforts would be impossible without all the work he has already done. The reason I didn’t incorporate more of his ideas and those of other members of the Mystara community was because I was creating a project for university and had decided to stick with TSR published sources as much as possible. I understand why Thorfinn has approached the Atlas the way he has, but decided to start from a different premise precisely because I have seen how he has developed his maps over the years.

As far as false assumptions, I probably could have made my point with a little more tact. My main issue with all the maps of Mystara has been the assumption of a specific projection without any evidence. This includes the weird “Robinson” projection provided in the hollow earth set and the equirectangular grid on the maps of Thorfinn and a few others. I remember reading on Dragonsfoot somewhere Frank Mentzer was asked what projection the original maps were in and he didn't remember but guessed it was equirectangular. But that didn’t definitively confirm anything. There's no reason to assume an equirectangular projection. If anything, the Mercator should be assumed as it is much more common in general purpose maps despite its inherent distortions. Without knowing what the masters set was based on, there is no reason to assume one projection over another.

I want to address a few things Thorfinn brings up to argue for an assumption of an equirectangular map; these include the compass on the master set, a rectangular border and the assumption that north is at the top of the map.

The presence of a Compass or North Arrow never implies a specific projection. Many maps will have a North Arrow even though they are not using a Mercator, equirectangular, or similar projection. I have even seen some globes with a north arrow, which is completely unnecessary. The common assumption that north is at the top of the map is the main reason for a common principle in modern cartography; namely, that a north arrow should not be on the map unless north is not the top of the map.

A rectangular border is only present in the Masters set because the page is rectangular and doesn't really say anything about the map itself. Every map I made for school had a neat line, it differentiates between the map and anything else on the page such as art work or text. The border on the Masters map serves the same purpose.

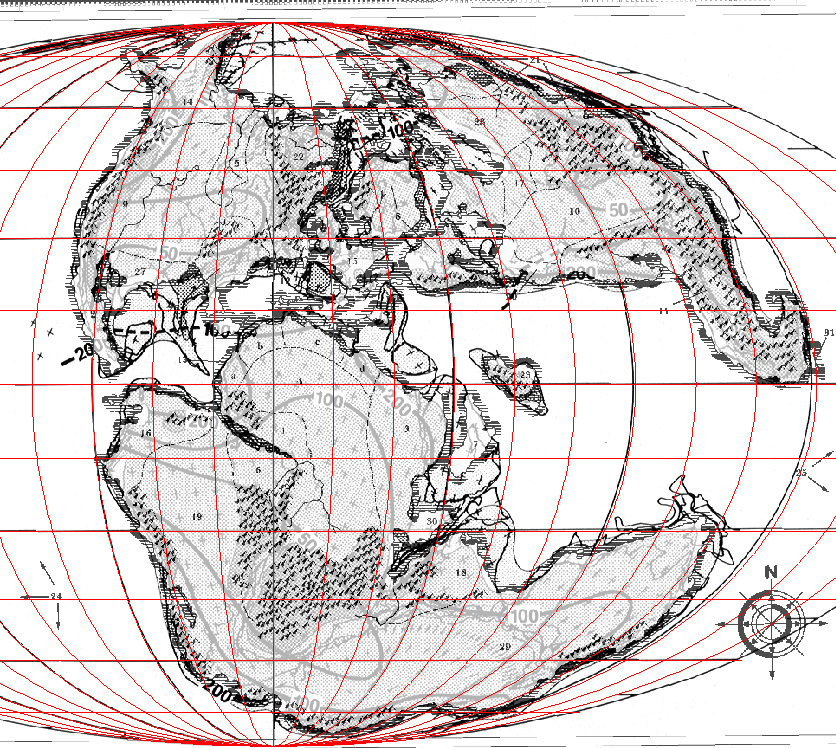
Let’s talk about projections. I am completely certain that the original Jurassic map, and therefore the known world of the master set, was in the Mollweide projection for 2 main reasons. First, all paleogeographic maps of a significant age that I have seen are in the Mollweide projection. Only maps made recently have had alternate projections, such as Plate Caree or Mercator. Second, I tried to match the Master's set to a reprojection of the Jurassic Map in an equirectangular projection. It doesn't match up at all. If Mentzer did a trace of a map, it was one that was already in the Mollweide projection. Also, the Jurassic map I used is labeled as being in the Mollweide projection, any good map will have such a label somewhere.

The lack of a scale or coordinate system on the master set map is irrelevant because it will assume those of the Jurassic map. This means that the scale of the hex maps must be subsumed by the Jurassic map. This results in each side of each hex being a different length. As much as I want to stay true to the first maps of BX and x1 they give no coordinates and so the georeferenced master set map takes precedence. Hex maps provide a basis for understanding the terrain and places but can't be taken at their given scale.

This doesn't mean the hex maps are “wrong”, only that the scale is off. They still provide plenty of geographical data.  Because the Masters map was traced from a map already in the Mollweide projection the hexes can be laid directly on top of the Masters map without distortion. Each hex will still contain the same square mileage as every other hex because Mollweide is an equal area projection. The hex scale will be off mainly because the scale of the Jurassic map wasn’t accounted for in the first place.

“Very important question here: is the map you're working from here the map upon which Mystara is based?”

It's impossible to know without direct confirmation from Francois or Frank, but if it isn't then it is one almost identical. As shown in my first post Frank Mentzer and Francois Froideval were at least considering the idea of using a map of Earth in the Jurassic period. Therefore, they had to have been using some reference map published as early as 82. The specific map I used can be found here. Christopher Scotese (one of the authors) published several different papers around the same time period that used an identical map. I was unable to find anything else published around the same time without Scotese's name attached; which doesn't mean there wasn't anything else that may have existed at some point, but considering how well the master's set lines up with what I used, I think one of Scotese's maps was the basis the Known World map. I am of the opinion that Mentzer did make some changes to the map as he stated on Dragonsfoot, specifically to fit the map as presented in the Isle of Dread into the Known World. I think Cook created his map without any plans to expand beyond what was presented, and when Mentzer took over he shoehorned Cook's map into a map of the Jurassic period which became the Known World.

As put so succinctly by Thorfinn, the key difference between our approaches is my assumption that Mystara is ancient earth. the only info we have for a basis of real coordinates of the earliest map is the statement in the books and by Frank that the known world is earth in “the age of magic”. I do hold the Masters map as having more validity as a model for what was originally intended for the known world. I may have some bias as I didn't discover the Mystara fan community until high school and only had the BECMI box sets and a few modules growing up, so I always knew it as the known world and not Mystara.

Regarding intents of the various designers and how the maps have been interpreted over the years: I am specifically trying to stay true to the intents of the original designers; those who created the setting and not later designers. Though I will use the work of later designers if it doesn't contradict the original vision of the setting. interpretations are just that, only interpretations, I feel no need to be beholden to those. giving the readers interpretations equal value to the original designers is like saying we should take into account the interpretations of the readers that LOTR is about the world wars when Tolkien repeatedly said it wasn't, though he of course may have been influenced by the time in which he lived. I am trying to account for intent of original designers, not readers who later became designers and interpreted the works of the original designers and threw so much of their work out the window(the first episode of the Voyage of Princess Ark).

I don't really strictly follow either camp concerning what is or isn't Canon. I don't adhere to the idea that later works should supersede earlier, or that less information is better and shouldn't be expanded. I actually prefer greater detail. As far as sticking to older sources, that has to do with the history of development of Mystara. With real world maps, newer generally trumps old because we have more accurate data derived from better methods of measurement and more refined Cartographic techniques. However, with Mystara we have the original maps made by cook, which provide no info for placement besides climate/culture; it was probably meant to span an area from Denmark to Italy regardless of what the scale of the hexes were in the end. Then Mentzer gives us a revised expert map and later the continental and world maps of BECMI. He really only added to the earlier work of cook. But then Bruce Heard comes along with the gazetteer series and voyage of princess ark and outright states that all of Mentzer’s work is wrong and inserts a new reality to the game. I appreciate Bruce's immense contribution and work and creative genius, but I'm not going to put his work above the original work of cook and Mentzer. So, my methods are to include everything from cook all the way to the 2e stuff as long as it doesn't contradict something published earlier or by an original designer. so, for example when gaz 1 changes the pop of specularum to 50000, I stick with the earlier number of 5000; and I give precedence to anything in cm4 as opposed to cm1-3(I’m not sure if there’s any actual contradiction between those products).

My methods of precedence of large vs small scale vary based on context. given that the map upon which everything is based is one of the entire world, the coordinates for the placement of any large-scale maps are predetermined. However, for specifics, such as differences in the coastline, I generally side with larger scale maps. Though I may make exceptions, giving the smaller scale maps precedence based on publication date.

Let's talk about scaling and overlaying and georeferencing. so, I did 2 instances of georeferencing, one with many control points requiring a 2nd or 3rd order polynomial transformation resulting in warping. this inevitably leads to the hex maps not matching the world or continent map even though there is greater fidelity to the Jurassic map. the method I used in the end was with two control point using a 1st order polynomial. I did this to maintain the integrity of the image as a rectangle even if it was rotated to some degree in order to best fit the Jurassic map. the reason larger scale map might not align perfectly with the smaller scale lines on the continental map is due to the variance in exact placement of control points. which pixel on a hex should match up with which pixel in the borders provided by the continental map? there is always a degree of error when georeferencing any raster, the error was only compounded by the fact that there was no vector data to match up with the raster, and instead the raster had to fit into another raster image. the difference in scale itself and how much area each pixel covers creates the error rather than any warping from georeferencing. In order to have each reference map a different layer they had to be individually georeferenced, I couldn't overlay them in illustrator and then georeferenced it because that results in single layer and single image.

As Thorfinn says the maps should overlay perfectly. Which they do as long as you only take one generation of maps at once, e.g. x1 x4-6 and cm1, but if you start matching up x10 or 11 or the dawn of the emperor's maps to earlier maps then there are problems. This is why Thorfinn has been working on his Lining up Mystara series for so long, not all of the hex maps line up like they should. Placing the early hex maps directly on to the continental map, everything fits fine as long as you accept that the hexes don't directly reflect the projection of the world map. Georeferencing itself won't cause warping unless higher order polynomials are used.

 In establishing coordinates for the hex maps, it is necessary to place the companion map because it is the only map which provides specific guidelines for lining up the hex maps onto the world map, without it I would be basing it on coastlines which vary between the companion and master sets, and  don't match up with the coastlines of the hex maps. using the map of Brun requires a slight rotation, meaning the hex maps get rotated with it and are not directly aligned along latitudinal lines. this rotation of the companion set is unavoidable. It doesn't line up with the Masters set without rotation. I've tried with illustrator, gimp and through georeferencing with control points, and in no case does it line up without rotation (If anyone can get it to line up perfectly I’d love to see the results).

With the coordinates for each map established and the hex maps lined up it is important to keep in mind that the hexes won’t keep their original scale. around Karameikos one 6-mile hex is generally only 4 miles north to south. In my mind this just confirms my theory that Mentzer shoehorned the isle of dread map into the world map and didn't account for scale. Also, the location of features in any given hex may not be in the center of the hex, but this is hard to quantify if we are only shown one symbol per hex it is impossible to know exactly where the location is in the hex without reference to a different map with larger scale hexes or to a description in the text.

“Would you be willing to share your DEM files”

 yes, the file is a geotiff. Here are links to both the base dem and a hill shade derived from it. As stated in the beginning of this post I will probably be changing it to better reflect how I think the landscape should flow in Karameikos.

I’ve been contemplating using the google api going forward for the web map in order to give the option of viewing from a global perspective, and because most people are familiar with the google earth interface already.

It’s been my plan since I first tried my hand at this a few years ago before I began my university thesis to create separate versions of Mystara for each publishing era: BX, BECMI, gaz, and post woi.

P.S. Since Thorf found the Jurassic map in that was mostly the map Mystara was based on (though we won’t know for sure until either Frank or Francois confirm it), I will base my future work on that and realign everything to it, there shouldn’t be any big changes, just slight adjustments.

31 May 2017

Building a Web Map, part 8

Since I'm going to be running a game today,  I wanted to be able to use the web map.  A big part of that usefulness fro me is the presences of hexagons for distance measurement. I know I already have a scale bar on the map, but I always find those pretty useless on interactive maps. So I generated hexagonal tessellation in ArcMap at 3 different scales: 6 mph, 24 mph, and 96 mph. I know Mystara is traditionally mapped at 48 or 72 mph at the smallest scale, but I felt I should be consistent in size difference because 24 is 4 times 6, whereas 72 is only 3 times 24, which works for the 8 mile hex, but I'm using 6 mph because I'm trying to stay consistent with the older source material and the 6 mile hex is great for measuring in general. Yes, that was a ridiculous run on sentence.

You may notice that the hexagon layer doesn't match up with the size of the hexes in the original maps. This is due to actually placing the maps in their geographic locations on Earth. I'm am positively sure that the "Continental Map" published in X1 and "The Grand Duchy of Karameikos" map published in the Expert set were developed prior to and independently of the "Known World" map which appeared in the masters set. So the map from Isle of Dread was smashed into a place on the world map that looked like it might fit, and the scale was retroactively applied to the world map. The scale of the hexagon layer and the scale bar are the accurate scale produced by matching the "Known World" map up with the map from the Jurassic, giving me actual geographic coordinates and a basis for an accurate map. If you prefer the original scale, it is fairly simple to convert; in most places the original hexes are 2/3 the size  they are supposed to be. So the 6 mile hexes in the original map are each about 4 miles across, thus the 6mph layer would be 8mph at the old scale.

Also you may notice a distortion of the hexagons as you get closer to the poles. This of course is due to the mercator projection used in pretty much all web maps. The hexagon tessellations appear as regular polygons in the mollweide projetcion (the original projection of the Known World map), but become warped in any other projections. Displayed in another equal area projection, such as the cylindrical equal area projection, the hexagons still maintain their area while shape is distorted.

28 May 2017

Building a Web Map, part 7

Sorry to anyone who actually keeps up with this blog, I know I haven't posted all week; I have been distracted by TotalWar. I haven't played any computer games all semester and I decided I have time and deserve a break, but then I got sucked into the hole that is Europa Barbarorum.

So, I finally updated the web map. It now shows a version of the poster map, along with a scan of the original known world and brun maps. I have started digitizing the smaller streams, and once I 'm done with that I plan to fix a few anomalies I didn't catch earlier so I can run the interpolation again. Then it should match the stream network on the poster map and I can move on to creating hexagons for the webmap and filling them with data.

21 May 2017

Building a Web Map, Part 6

School is now over!

I presented my thesis on monday, I'm going to upload it as a link in the sidebar. The web map has all of the locations placed with custom icons and popups.

also I finished a poster of Karameikos for another class, I'll also post a link along with the paper for that project, but here is a screenshot.


Of course I continue to plan working on this project, I am going to upload a modified version of the of the poster to the web map as a new basemap. From there I will probably be working on a hex overlay with info tied to each hex.

There are still a few locations that need to be placed, I'll listthem below with pertinent information, If you have any input, let me know.


  • Village of Kaldarak/plains of desolation, on road, between carrabridge and ford, several farms nearby, near dapleth woods home to elves and treants, Dungeon 15 pursuit of the Slayer
  • Elven Home, in sylvan wood, treeant, Dungeon 1 Elven Home
  • Elwyn's Sanctuary, deep wilderness, in domain of patriach sherlane, elwyn made deal with shrine of evil chaos, B9 and B1-9
  • fire giant home, large mountain with cae entrance in foothills, AC10
  • Tuma, mountains spurs in west, sylvan forest in north, desert around ctiy of tuma, most likely northwest of wereskalot in 5 shires or lake amsorak in darkokin, B8
  • Giant's castle, in northern mountains, more than 3 day journey from town to castle, above the treeline on a black mountain, AC10
  • guido's fort, probably on edge of malpheggi swamp south of darkin, B5
  • Haven, original orange book in gulluvia/glantri, green book in karameikos - 'valley in heart of altan tepes' according to B 1-9, placed north of lake of lost dreams south of zargash mountains in 83 expert
  • Highdell, on duke's road, at source of river, 83 expert
  • hive brood lair, near rugalov north of road, Dungeon 13 of nest and nations
  • mist raven, destroyed in explosion rebuilt, AC11
  • white dragon cave, 10 day journey into mountains, trail leads past and through mountains, in ravine with spring, pine trees, AC10
  • Mt Caylorne, abandoned dwarven city
  • port town, trade from caravans to south to north sea, zenopus tower on hill near city, Holmes Basic
  • Gray Mountain, in elven forest, middle eastern overtones, mountains to north, B7
  • spinyon, small village far from trade routes, grows corn and wheat, AC11
  • stonefast, abandoned dwarven stronghold, on edge of human territory, white dragon, classic D&D 
  • stone peak, dwarven kingdom, AC11
  • dragon lair, dragon in wulfwolde hills raiding peasants on edge of moor, Dungeon 27 Tarfil's tomb
  • Zanzer tem's Tower, near town, salt mines and dungeon below, classic D&D

03 May 2017

Building a Web Map, part 5

I have begun redoing the location markers. I have divided locations by category: settlement, stronghold, lair, ruins, and dungeon. I Have been working on updating one category at a time. I have finished the settlements. They can be seen on the webmap split into different layers with different icons. The categories of the settlements are based on the population of each place, based on the pop figures in the RC or Expert books. The different categories are Homestead, 1-49 pop; Village, 50-1,000 pop; Small Town, 1,000-4,999 pop; Large Town, 5,000-14,999 pop; City, 15,000-99,999 pop; and Metropolis, 100,000 or more pop, the last category being one I invented.

Of course Karameikos has no cities or metropolises, if you go with pre-gazetteer numbers. I think I am going to have Specularum have a population of 7,000 because it is stated as having 70,000 in Kingdom of Adventure. My general rule of thumb for pop figures post gaz is to divide everything by 10, but the city as shown in B6 is a little large for a medieval town of 5000 people even if you take the scale which shrinks the city. So I think 7,000 is a good compromise number; 5,000 of the people could be of thyatian origin, and 2,000 could be traladaran. the traladarans just aren't included in population figures normally. The same principle applies to Threshold. In the expert set the town is said to have 400 inhabitants plus 100 visitors, and then it says it has 500 inhabitants and 50 demihumans and visitors. Both those numbers are given on the same page. we could reconcile that by saying the extra 100 are traladarans not given full citizenship by the karameikans/thyatians.

Anyway, I created the settlement markers in Adobe Illustrator. I just traced an image of the legend given in the Kingdom of Adventure poster map, with some slight modifications. I have also created symbols for the stronghold and dungeon categories, but have yet to put those locations on the map and port them over to the web app.

Because blogger kept messing up the map, and the marker symbols, I decided to just have the blog redirect to a web portal on my student account at the school for now. It seems to be working just fine so far. I'm currently working on a new base map, based on the elevation model I created, as a side project for another class, and hope to finish it over the weekend, when I do I'll be uploading it to the web map as another base layer.

28 April 2017

Building a Web Map, part 4

Well, the most difficult and time consuming part of the project is done; the DEM is finished. It's not perfect, but the original data wasn't perfect either. Here is the finished product, followed by an explanation.

The first thing I did was I identify points where I knew the exact elevation. There were just a few of these such as mountain peaks. For others I had relative elevations, such as the keep on the borderlands. the contour lines were marked as change of 25ft in elevation, but I had no base elevation. At other places I had general descriptions or average elevation. Also there were the maps from B10, Night's Dark Terror which had ridge lines of mountains depicted. This was useful for knowing the direction of slopes and adding more details to those areas.

In order to determine which method of interpolation was best, I did some testing with the keep on the borderlands map, which can be seen in a previous post. Interpolation is a mathematical method of predicting what the values of a certain geographical point will be based on the known values of surrounding points. I ended up working with the Topo to Raster tool which uses the ANUDEM method developed by the Australian National University Fenner School of Environment and Society. It is essentially a modification of the standard spline interpolation method, which can be described as taking a rubber sheet and spreading it over a given area and making certain it passes though specific points. The ANUDEM method is unique in that it allows for the input of more than just points; you can include rivers, cliffs, contour lines, coastlines, hydrological sinks, and lakes.

I first created contour lines, cliffs, and rivers. Then to create elevation points I created a single point for each hex from various maps, whether they were 6mph, 3mph, 2mph, or 1/2 mph. then I selected different hexagons within a certain area and generated random values within a certain range based on descriptions in the text. For the mountain ranges shown in B10, I detailed the values a little bit more meticulously. Though this may sound fairly easy and simple, it was extremely time consuming and took a lot of fine tuning to get just right. In the end there were over 8000 input points! I often had to go back and run test interpolations to catch anomalies and fix those points to better match the description of the text. Below is a screenshot of all my input data. From the final result I created a hillshade which I then placed over the DEM as a transparent layer and got what you see above. I will upload it to the web version shortly.


21 April 2017

Keep on the Borderlands Hillshade

I used the elevation data from keep on the borderlands to test out DEM creation/manipulation. I used a ANUDEM interpolation tool in ArcMap, and from that I constructed a hillshade. below the original is is shown transparent over the hillshade both with and without color.

 The keep itself


The Caves of Chaos


I imported it into ArcScene so you could see it from different perspectives.
view from the road approaching the keep
 

view from the keep looking across the river

view into the ravine

14 April 2017

Building a Web Map, Part 3

I know its been awhile since I've updated the project; there's still a lot of work to be done before it's really finished. I just finished tabulating all the data from every source that gives information about karameikos.

Sources used include: 81 basic rules, 81 expert rules, x1, b5, holmes basic, 83 basic rules, 83 expert rules, b1, b2, ac2, sword of justice, ac10, b10, companion rules, chapel of silence, b9, elven home, x12, gaz1, b1-9, of nest and nations, wererats of relfren, in pursuit of the slayer, b11, ac11, tm1, tm2, b12, in the dread of night, tarfils tomb, hrothgar's resting place, night of fear, dda3, who's who among dragons, rules cyclopedia, dda4, warth of immortals book, novel ideas, ac1010, Ransom, champions of mystara book, karameikos ho, magic of karameikos, hail the heroes, classic dnd game, first quest adventure book, night of the vampire, menacing malady, voyageof the crimpshrine, kill bargle, karameikos kingdom of adventure.

I can finally move on and work on the actual map. YAY! Mapping is the easy part; data acquisition and preparation are always the most time consuming and difficult part of any GIS project. From here I am going to integrate all the maps from the above sources into my ArcMap document. I have already done many of them, such as the wilderness maps from b10 and ac2, but there are a few that need to still be added such as the map of the black eagle barony in dda3. At the same time I will be working on analyzing any topographic data and applying that to a Digital Elevation Model(DEM) from which any further basemaps will be developed.

In the morning I will be running my game continuing where we left off in the kelven moor.

25 March 2017

Building a Web Map, Part 2

Alright, I was finally able to get some basic markers and popups to work.  I wasn’t able to accomplish as much this week as I was hoping.  I ended up working extra hours this week because I was off school for spring break, so I couldn’t spend that time working on the map as I had planned.

Before placing any locations on the map, I organized the data I had preciously collected into one excel file. I split the locations into two broad categories, adventure locations and population locations. for adventures, I included data about type of adventure, ruin, dungeon, lair, mine, and graveyard; type of monsters present such as humanoid, or undead; the big boss of the adventure; and the source where the adventure can be found. For population centers I included different categories, type of population center, total population, faction loyalty, military capability, the current ruler, and main economic activities. For this category I included major humanoid locations that were the locations of a lair for an entire tribe.

Once I had all this data organized, I needed to create actual points in ArcMap to match to all the locations. To do this I used Thorfinn Tait’s updated map of Karameikos modified with forested hills as a reference. I was able to georeference this 8mph using the24mph expert map as a basis. however, this map doesn’t match up perfectly and I had to use more than two control points to get it to line up, even then it still doesn’t completely agree with the earlier 6mph map or the 24 mph map published in the expert set. The most notable differences occur in the route of the rivers and the shape of the peninsula by Specularum. There are also more hexes classified as mountainous as opposed to hilly, and some of the settlements are off by a smidge. These differences can be seen in the image below, the 8mph map is displayed at 50%transparency on top of the other maps with the created locations symbolized as red and purple circles. Once I had this reference map in place, I was able to create a new shapefile and add points features to it for each location. I used the 6mph map as a primary source, and where a location wasn’t marked on that map, I used the 8ph map.


With the point locations created, now I needed to join the data from my excel file to the shapefile. this proved troublesome. the join tool failed to operate when I attempted to join the two attribute tables with the excel table. I could have figured out the issue, which probably had something to do with the formatting of the excel table, but since I hadn’t created a great number of points I decided to just copy and paste the data from the excel file to the attribute table of the shapefile.

With my work in ArcMap completed, I moved on to moving the features I had created into the web map. This is where the most time was spent and I kept running into roadblocks. The main goal here was to convert the shapefile into a geoJSON format and then use that to create popups displaying the properties of each marker.  Converting to geoJSON seemed to be easy at first. There was a tool in ArcMap which allowed me to easily do this. however, the end result had to be modified. This is what the tool gave me for the adventure site of Koriszegy Keep:

{"type":"FeatureCollection","crs":{"type":"name","properties":{"name":"EPSG:3857"}},"features":[{"type":"Feature","id":0,"geometry":{"type":"Point","coordinates": 419432.17583047762,3141498.3623768883]},"properties":{"FID":0,"Id":0,"Name":"Koriszegy Keep","Type":"Ruins","Monsters":" Humanoids, Werewolves, Undead, Lowlife","Boss":" Rodemus Family","Module":"Modlvay Basic"}}]}

The issue here is the coordinates provided. In order for the point to be displayed properly the x and y values must be in decimal degrees; currently a northing and easting are displayed in meters, specific to the projection used (web Mercator). Also, the latitude and longitude values need to be swapped, so they appear as long(x), lat(y). Also, seen in the code above is the definition of the projection used (the section following crs), this can be deleted as the coordinates used in the future will be unprojected in decimal degrees. The resulting geoJSON feature looks like this:

{"type" : "FeatureCollection",  "features" : [{"type" : "Feature", "id" : 0, "geometry" : { "type" : "Point", "coordinates" : [3.76782, 27.1442 ]}, "properties" : {"FID" : 0,"Id" : 0,"Name" : "Koriszegy Keep", "Type" : "Ruins", "Monsters" : " Humanoids, Werewolves, Undead, Lowlife", "Boss" : " Rodemus Family", "Module" : "Modlvay Basic"} } ] }

When first trying to import this geoJSON into leaflet, nothing would happen. the feature was inserted as a variable within the body of the script at first, with the L.geoJson following the map initialization. I tried several different things to get it to work, some of which caused the map to not even initialize. I even attempted to use mapbox to display the data. I was able to upload the data, and display points, but o make popups work I had to rewrite the entire map code from scratch in the mapbox GL JS. This I failed to execute successfully, so I gave up on that. After a day of not being able to get anything done I was able to find some more examples and resources about geoJSON that I had not looked at before. I ended up placing the geoJSON variables in the header of the document in two separate scripts for each variable. It may not have been the most efficient way to write it, but it ended up working.  The last part I did was to have the markers be clickable and display the properties of each feature. This was done using the onEachFeature function combined with layer.bindPopup.

This post has grown larger than I expected, given the changes made to the map are relatively minor. In the next few weeks I will be adding more markers, different symbols based on feature type, a base map of my own devising, and possibly a routing option. If you have any comments about the process far, or have input about how the data should be displayed please leave a comment. 

20 March 2017

Building a Web Map, Part 1

I have put up a link to the web map under the blog header. At the moment, it is just a base map different scale maps. All the maps used in the app so far are replica maps made by Thorfinn Tait. Establishing a Base Map In a previous post, I discussed how the basis for all the maps of Mystara can be referenced back to a paleogeographic map from the early 80s. With the goal of determining an accurate geographic location for all the maps and places of Mystara, the original paleo map had to be georeferenced. Most raster images must be georeferenced at some point, whether it be an old historical map, or satellite imagery. Georeferencing is a process in which a map is placed on a geographic grid based on some key control points. Generally, the more control points the better fit. In this case as the late Jurassic map most likely served as the basis for a tracing which was modified to the map of Mystara, it was important to use only two control points in order to scale and rotate the map to the right position. This same principle applied to the georeferencing of all the other Mystara maps also. the control points to establish the position of the late Jurassic map, and thus all other maps, were based on the latitude and longitude lines of the original map. as shown below it can be seen that this process resulted in some of the outer longitude lines not matching up perfectly with a digital dataset of longitude and latitude lines. A second georeferencing was done with more control points, resulting in a perfect match between the digital coordinates and the image, but this also resulted in a less perfect match between the world map of Mystara and the late Jurassic map, so the origianl scaled image shown below was used as a basis for all other maps.

The world map of Mystara was georeferenced using the basis of the late Jurassic map. Control points used were points along the coastlines that were common to both maps. this resulted in a less than perfect match, so both points had to be moved until a best fit was found; the end result showing a comparison between the two can be seen below.

In order to fix the larger scale maps to this model accurately it was necessary to use a continental map from the D&D Dungeon Masters Companion: Book Two, which shows outlines of exactly how the larger scale hexagonal maps fit into the world map. A personal scanned copy of this map which had been matched to the world map using GIMP, was then georeferenced to the same location as the map pictured above. Based on the continental map, the map presented in X1: Isle of Dread was georeferenced.

At this point, colored version of the same maps already discussed were georeferenced, along with the 6 mile per hex(mph) map that appeared in the D&D expert rulebook published in 1981.

Moving the Base map to the Web with a general base map is established, work can begin on the web application. The web map was built using leaflet and mapbox. After learning the basics of mapbox, each of the layers (the world map, continental map of Brun, 24mph known world map, and 6mph Karameikos map) established in ArcGIS was imported as a tile set into mapbox. While doing this, it was discovered that mapbox needed raster tile sets to be already established in the Web Mercator projection. If this was not done map box would either take a very long time to reproject the raster, or be unable to upload the raster entirely. Another issue that was encountered occurred when loading a raster formatted with a color map. when this raster was uploaded to mapbox the result was a greyscale image. To properly display color rasters in mapbox, all images must be in an 8-bit unsigned three color band format (three versions of the image in red, green, and blue). Thus, all the images were reprojected in the web Mercator projection and converted to a three-color band format. Once all four tile sets were uploaded they were added to a single style in map box, and opacity was adjusted for each image dependent on zoom level. below is a view of Mystara in the web Mercator format, and as expected, the poles are severely warped; outlines of current continents are shown for comparison. 

With the base map hosted on map box it was fairly easy to port that over to a leaflet application. This is the code so far. I put the map on a separate page on the blog which is linked underneath the header just as test to make sure it works. Next steps involve adding location markers and popups with data.

27 February 2017

The Project

First off, let’s talk a little bit about my background. I have been playing Dungeons and Dragons for as long as I can remember (about 20 years). One of my earliest memories is waiting for my Dad to come home from work so I could play my first game of D&D. That first character was an elf named Zeniff. We had later forgotten I played that character, and my family insisted I hadn’t played D&D before we moved to our new house; they insisted my first character was my cleric, Paul. When I was in high school we found Zeniff’s old character sheet, so I could finally prove I played D&D at the old house. Anyway, we played using the old BECMI boxed sets in the Known World, and were pretty isolated from anyone else who played D&D until middle school and high school.

When I was in middle school I played a few games of Alternity, Rifts, and World of Darkness with my older sisters’ friends who were in high school. It was about the same time that I became aware of the 3rd Edition of D&D and other RPG groups. I DMed my first game when I was a sophomore in high school. It was also during high school that I began to read RPG forums (like ENworld) and blogs. By the end of high school, I had made so many houserules and adaptations from other games in order to ‘fix’ D&D that I decided to create my own game system. The first complete version was finished by the end of 2010; currently I’m in the middle of editing, reorganizing and rewriting large parts of my system. I’ll post more details about it at some point in the future.


On to the matter at hand, I am currently studying Geography at the University of California Northridge. I will be graduating at the end of this semester and am working on my capstone project.  My project will consist of building a web map and analyzing the benefits and drawbacks of such an application, specifically in regards to fantasy and rpg maps. 

Computer based mapping in the form of GIS software has been around for several years. Digital map making is nothing new, but for a long time only those with the right skills and training could make use of GIS software in order to create digital maps. The end result was often a static map, in paper form, or as a part of a digital presentation. The basic cartographic design has remained relatively stable in this transformation of medium. However, the introduction and widespread use of web maps is having a dramatic effect on the profession. The ability of a web map to be interactive affects many of the basic assumptions about creating a good map. Things as simple as zooming in and out and panning around on a web page influence how a map is perceived and used. With the web map, the main concern is how the map will be used by the public more than strictly adhering to any single dogma of how to make a good map.

In the midst of all this change in the field of cartography, publications dealing with the fantastic are left behind. The common paperback novel still has the same style of generic fantasy map that persisted thirty years ago. Maps of fantasy worlds have been published in RPG books for decades with little change. These maps are also often released as pdfs, but they were designed to be printed either as poster or on a page in a book. The cartographers of the RPG industry rarely use or make hand drawn maps, but they are not using GIS software either.  Campaign Cartographer, Adobe Photoshop and Microsoft Publisher are common software programs used among fantasy cartographers. The maps produced are often aesthetically pleasing, but of little use if trying to describe a location.

The goal of this project is to show how fantasy cartography can make use of modern technology and how that will benefit those who play RPGs. The webmap I construct will showcase the world of Mystara.

The world of Mystara is a fantasy setting that was developed for the Dungeons and Dragons game in the early 80s. It was specifically made to introduce new gamers into a setting that contained all the elements of Dungeons and Dragons and showcased how a new Dungeon Master might create a fantasy world. Most of the countries in the setting were modeled after a real world historical cultural in order to show new gamers how to use different aspects from history as inspiration for a fun game. The actual world map was derived from a paleogeographic map of the earth during the Jurassic period. Ultimately many different versions of this setting were published over the course of about 15 years in many different game books. These publications often contradicted each other or redrew the map in some places. A lot of work has already been done by fans in solving contradictions and filling in gaps. However, a lot of this work has been undertaken under some faulty assumptions and are not geographically accurate as a result.

This project will focus on the Grand Duchy of Karameikos in the fantasy world of Mystara. The culture of the area can be described as resembling medieval England shortly after the Norman conquest in 1066. The country covers an area of approximately 22,260 square miles, an area slightly larger than modern Croatia. The reason for focusing on this area is to limit the scope of the project, in addition to the fact that this area has the greatest amount of detail published about it within the world of Mystara.

As stated previously, the work of others, though amazing and not to be belittled, has almost entirely been based on some false geographic assumptions. The first and probably most important detail ignored is the origin of the world map. The world of Mystara is clearly stated to take place on earth long ago in one of the rulebooks (even though it is also stated that the Dungeon Master can change this fact).
The home world of human player characters as portrayed in the D&D Basic, Expert, Companion, and Master sets is . . . simply our real one, but at a point in the far past. The land masses diagrammed in the Companion set are a rough depiction of the ancient world of Pangea. The continents have only begun to drift from their early unified position, following the modern theories of the shifting tectonic plates. . . We have the elements of fantasy to this likely early configuration, and the result is the campaign world described in the boxed sets and adventures. This period of Earth’s history is therefore known as the Age of Magic. (DM’s guide to Immortals, p. 5)
In addition to this several times in recent years the creator of the world, Frank Mentzer has stated that the basis of the world map was a historical map of Pangea.

“Some of the Suits wanted to create their own in-house campaign world for D&D (i.e. no royalties for a change) and thus Mystara was born. It started with a worldmap of Pangaea from Francois Froideval, twiddled by yours truly, and introduced in brief in the DM's Companion and extended to the entire world in the Master DM's Book." (Frank Mentzer, 4 Aug 05, http://www.dragonsfoot.org/forums/viewtopic.php?f=106&t=10717&p=216320&hilit=Francois#p216320 )

during BECMI the topic of a Base World did come up, and Tom Moldvay had included certain details in his set (and Zeb's X-1 module likewise). I remember discussing the topic with various folks (mostly Gary), and Francois Marcella Froideval contributed a map of earth dating geologically somewhere between single-land-mass preprepreprehistory and the current state of continential drift. (Frank Mentzer, 2 Sep 10, http://www.dragonsfoot.org/forums/viewtopic.php?f=106&t=35588&p=947988&hilit=Francois#p947988 )

Though Francois and I had frequent contact, as we were both creative friends of Gary, I wasn't familiar with the things he did while he visited TSR. I don't even know if he was an employee. Early in the period that I was developing BECMI I had openly invited everyone to contribute or participate, and Francois retooled the historical map of Pangaea (Earth before continental drift) as a suggestion for my new world, and I accepted it and took it from there. (Frank Mentzer, 31 Aug 06, http://www.dragonsfoot.org/forums/viewtopic.php?f=11&t=10717&start=1500 )

“We played with plate tectonics as early as '82 (when Francois pushed it)” (Frank Mentzer, 23 Oct 13, http://www.thepiazza.org.uk/bb/viewtopic.php?f=85&t=11264&p=134142&hilit=francois#p134142 )

This idea of setting D&D as Earth’s Age of Magic was ignored in later publications, so numerous contradictions grew up between the early publications and later expansion material.

“One interesting side effect: since I was doing the entire boxed set line alone, and since TSR was using committees for most of its designs of that magnitude -- a procedure with which I simply refuse to comply; I almost always work alone -- I was not only uninvolved with the Mystara world line but was also never consulted about anything in it” (Frank Mentzer, 4 Aug 05, http://www.dragonsfoot.org/forums/viewtopic.php?f=106&t=10717&p=216320&hilit=Francois#p216320 )

Figure 1


The modified map of Pangea was presented in the Masters set as seen in figure 1 without any geographical reference (latitude or longitude, projection, scale), and any work that subsequently expanded on it has been guesswork. Taking the statement that Mystara is earth in the past as a basis, then it follows that earth’s geography and everything we know about mapping the earth’s surface should be applied to Mystara as well. If modern paleogeographic maps are examined, it can be seen that the map of Mystara closely matches that of the late Jurassic period (http://www.scotese.com/late1.htm ), yet the match is not exact. A map of the same geologic time period must be found that would have been available to the publishers of Dungeons and Dragons before the release of the continental and world maps of Mystara. From the quotes above it can be surmised that work on the world map had begun as early 1982 or 83. This was well in advance of the publication of the Companion set which was released in 84. A map matching our criteria can be found in a publication about rainfall patterns in the Mesozoic (Parrish, J. T., Ziegler, A. M. and Scotese, C. R.,. (1982). "Rainfall patterns and the distribution of coals and evaporites in the Mesozoic and Cenozoic."). This map almost perfectly matches that of the world map of Mystara(compare Figure 2 with Figure 1). Based on the original paleomap I will be using the Mollweide projection to map Mystara.
Figure 2

If you have followed me this far, please take 10 or 15 minutes to complete the following survey.