Alright, I was finally
able to get some basic markers and popups to work. I wasn’t able to
accomplish as much this week as I was hoping. I ended up working extra
hours this week because I was off school for spring break, so I couldn’t spend
that time working on the map as I had planned.
Before placing any
locations on the map, I organized the data I had preciously collected into one
excel file. I split the locations into two broad categories, adventure
locations and population locations. for adventures, I included data about type
of adventure, ruin, dungeon, lair, mine, and graveyard; type of monsters
present such as humanoid, or undead; the big boss of the adventure; and the
source where the adventure can be found. For population centers I included
different categories, type of population center, total population, faction
loyalty, military capability, the current ruler, and main economic activities. For this category I included major humanoid locations that were the locations
of a lair for an entire tribe.
Once I had all this data
organized, I needed to create actual points in ArcMap to match to all the
locations. To do this I used Thorfinn Tait’s updated map of Karameikos modified
with forested hills as a reference. I was able to georeference this 8mph using
the24mph expert map as a basis. however, this map doesn’t match up perfectly
and I had to use more than two control points to get it to line up, even then
it still doesn’t completely agree with the earlier 6mph map or the 24 mph map
published in the expert set. The most notable differences occur in the route of
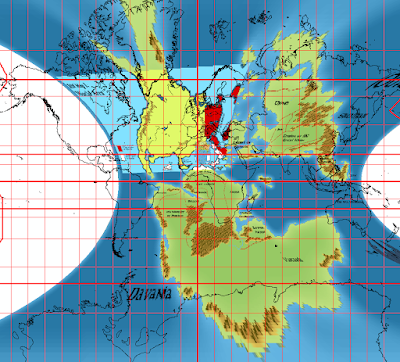
the rivers and the shape of the peninsula by Specularum. There are also more
hexes classified as mountainous as opposed to hilly, and some of the
settlements are off by a smidge. These differences can be seen in the image
below, the 8mph map is displayed at 50%transparency on top of the other maps
with the created locations symbolized as red and purple circles. Once I had
this reference map in place, I was able to create a new shapefile and add
points features to it for each location. I used the 6mph map as a primary
source, and where a location wasn’t marked on that map, I used the 8ph map.
With the point locations
created, now I needed to join the data from my excel file to the shapefile.
this proved troublesome. the join tool failed to operate when I attempted to
join the two attribute tables with the excel table. I could have figured out
the issue, which probably had something to do with the formatting of the excel
table, but since I hadn’t created a great number of points I decided to just
copy and paste the data from the excel file to the attribute table of the
shapefile.
With my work in ArcMap
completed, I moved on to moving the features I had created into the web map. This is where the most time was spent and I kept running into roadblocks. The
main goal here was to convert the shapefile into a geoJSON format and then use
that to create popups displaying the properties of each marker. Converting to geoJSON seemed to be easy at first. There was a tool in ArcMap
which allowed me to easily do this. however, the end result had to be modified. This is what the tool gave me for the adventure site of Koriszegy Keep:
{"type":"FeatureCollection","crs":{"type":"name","properties":{"name":"EPSG:3857"}},"features":[{"type":"Feature","id":0,"geometry":{"type":"Point","coordinates": 419432.17583047762,3141498.3623768883]},"properties":{"FID":0,"Id":0,"Name":"Koriszegy
Keep","Type":"Ruins","Monsters":"
Humanoids, Werewolves, Undead, Lowlife","Boss":" Rodemus
Family","Module":"Modlvay Basic"}}]}
The issue here is the
coordinates provided. In order for the point to be displayed properly the x and
y values must be in decimal degrees; currently a northing and easting are
displayed in meters, specific to the projection used (web Mercator). Also, the latitude
and longitude values need to be swapped, so they appear as long(x), lat(y). Also,
seen in the code above is the definition of the projection used (the section
following crs), this can be deleted as the coordinates used in the future will
be unprojected in decimal degrees. The resulting geoJSON feature looks like
this:
{"type" :
"FeatureCollection", "features" : [{"type"
: "Feature", "id" : 0, "geometry" : {
"type" : "Point", "coordinates" : [3.76782,
27.1442 ]}, "properties" : {"FID" : 0,"Id" :
0,"Name" : "Koriszegy Keep", "Type" :
"Ruins", "Monsters" : " Humanoids, Werewolves, Undead,
Lowlife", "Boss" : " Rodemus Family", "Module"
: "Modlvay Basic"} } ] }
When first trying to
import this geoJSON into leaflet, nothing would happen. the feature was
inserted as a variable within the body of the script at first, with the
L.geoJson following the map initialization. I tried several different things to
get it to work, some of which caused the map to not even initialize. I even
attempted to use mapbox to display the data. I was able to upload the data, and
display points, but o make popups work I had to rewrite the entire map code
from scratch in the mapbox GL JS. This I failed to execute successfully, so I
gave up on that. After a day of not being able to get anything done I was able
to find some more examples and resources about geoJSON that I had not looked at
before. I ended up placing the geoJSON variables in the header of the document
in two separate scripts for each variable. It may not have been the most efficient
way to write it, but it ended up working. The last part I did was to have
the markers be clickable and display the properties of each feature. This was
done using the onEachFeature function combined with layer.bindPopup.
This post has grown
larger than I expected, given the changes made to the map are relatively minor. In the next few weeks I will be adding more markers, different symbols based on
feature type, a base map of my own devising, and possibly a routing option. If
you have any comments about the process far, or have input about how the data should
be displayed please leave a comment.


